Symmetry in Chaos
Introduction
At first glance, symmetry and chaos would seem to have little to do with each other. Symmetry is order, harmony; while chaos is, well, chaos. But it turns out, the two have a deep connection underneath. Chaos can be harnessed and put in the frame of symmetry to create rich forms, where chaos gives it the pattern, and symmetry gives it the shape. These themes are explored in the beautiful book Symmetry in Chaos by Michael Field and Martin Golubitsky, which inspired this post.

How it's made
The idea behind it is elegantly simple. You take some initial point on the complex plane, and iterate some function on it. (If you are new to these kinda things, iterating means taking a point, applying a function on it to get a new point, applying the function on the new point to get yet another point, and on and on.) The authors suggest the following function with the desired properties of symmetry and chaos:Because of chaos, the trajectory of the points (the fate of the successive points on iteration) is extremely sensitive to the initial point. Two points which start off very close together will start to diverge from each other in just a few iterations, and after a while all traces of their close origins will be completely gone.
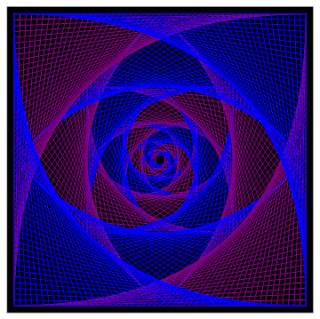
However, all is not lost if you are willing to look at the big picture. Just as it's hopeless to keep track of each individual molecule of a gas, but we can extract meaningful parameters like temperature if we're willing to take a statistical approach, so it is that a pattern emerges if we take a statistical approach here. In particular, imagine the complex plane to be partitioned into little squares, which conveniently map to individual pixels in our picture, and count the number of times the trajectory hits each square. Translate this hit count into colors, and you've got yourself a very pretty picture!
You'll notice that a lot of the pixels are hit only a few times, and a few pixels are hit a lot of times. You could take many approaches to put that information into your picture while dealing with such an enormous range. Logarithms come to mind. Or you could assign a cumulative hit count to the pixels, as I've done here.
Doing it in JavaScript
I'm sure many people who read the book wrote programs to make the pictures themselves, but I didn't find one place on the web where they are drawn in your browser directly. So I decided to make it here in plain JavaScript, with the HTML5 Canvas API. As a bonus feature, the picture is updated every second after a hundred thousand iterations, so you can see the picture emerging from its ghost. Pretty, right? Hit the start button below to set it off, and hit stop when you're satisfied. The calculations are quite CPU intensive, so you probably don't wanna keep it running forever.The picture
Thank you for reading the post, or skipping to the end! After all that explanation, enjoy the picture!That's all I have now. See you in the next post, then. So long!

Comments
Post a Comment